

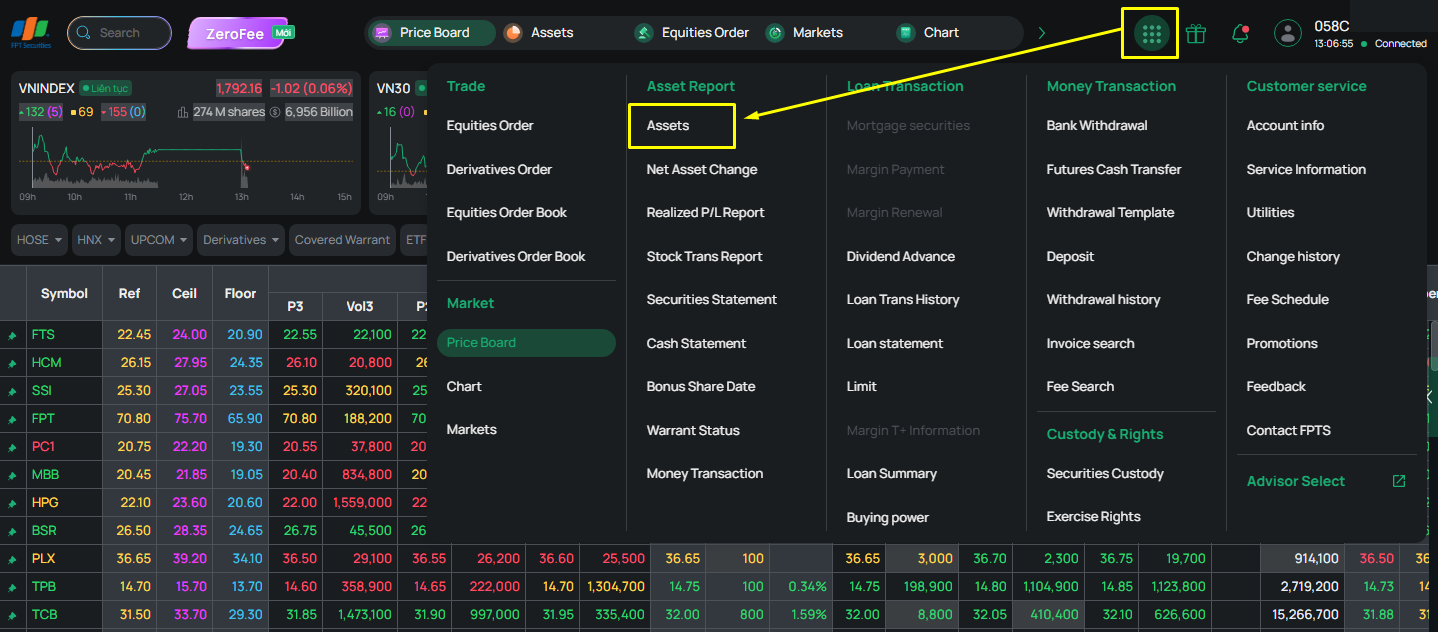
The Asset Report is a comprehensive report on your assets, with data updated in real time during the trading session, to help you monitor and trade promptly, and to conveniently track and control your assets.
Key features of the report:
- Real-time updated data includes: matched-order data, cash and securities data, market prices of securities symbols, estimated average cost price, and expected profit/loss. (See how the average price is calculated here)
- Place a quick Buy/Sell order from the screen.
- A table showing net asset value and net asset value fluctuations.
The Asset Report is divided into three main sections: Cash, Securities, and Net Asset Value Statistics:
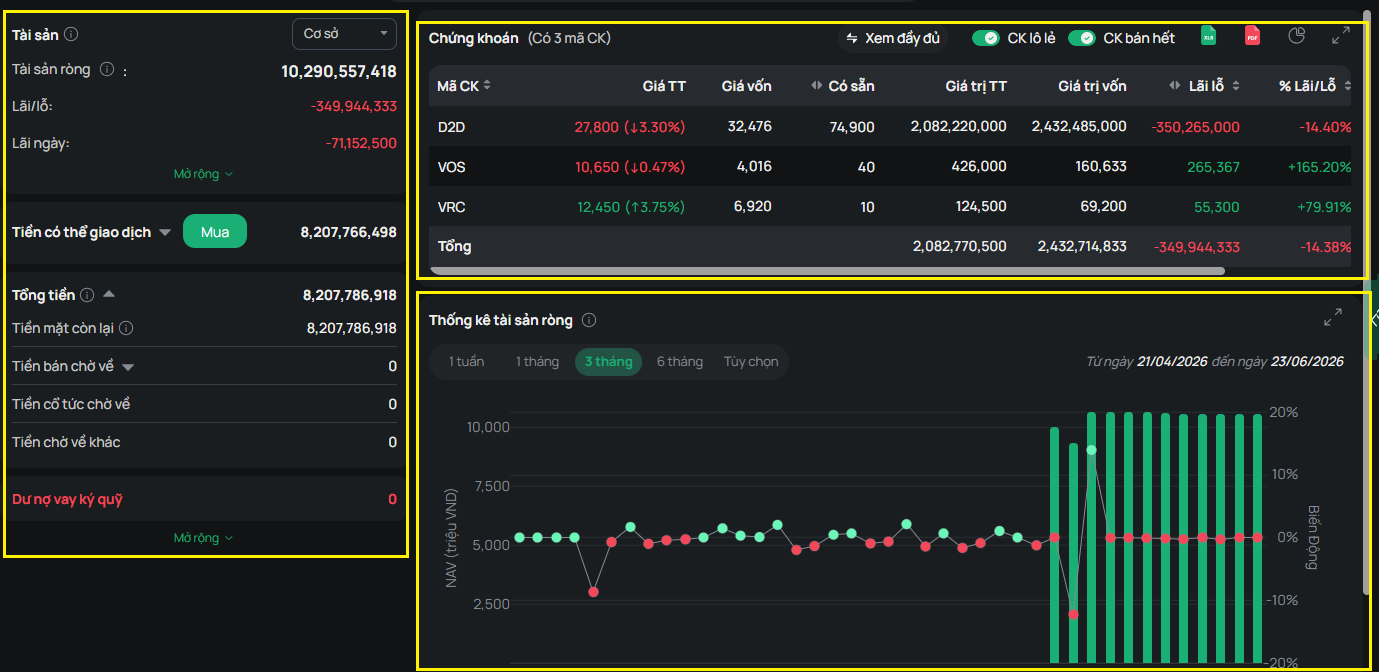
- Cash section:
- Click Expand or Collapse to expand or narrow the data area
- Click Buy to open the Quick Order table
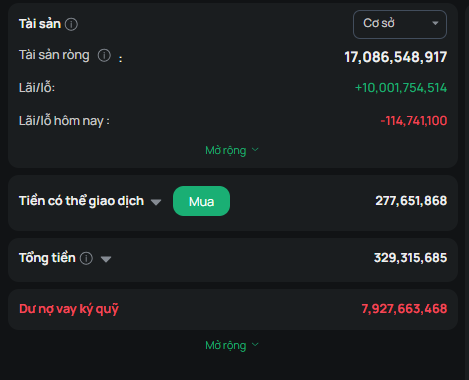
- Securities section:
- Click View Full/View Condensed to view detailed or condensed data.
- Click the Odd-Lot Securities button to hide securities symbols with only an odd-lot volume remaining
- Click the Fully Sold Securities button to hide securities symbols that have been fully matched (for that day)
- Click the icon
 to view the portfolio as a chart of: Capital structure and portfolio weighting
- Click the icon
 to view the Securities Portfolio data in full-screen mode
- Net Asset Value Statistics:
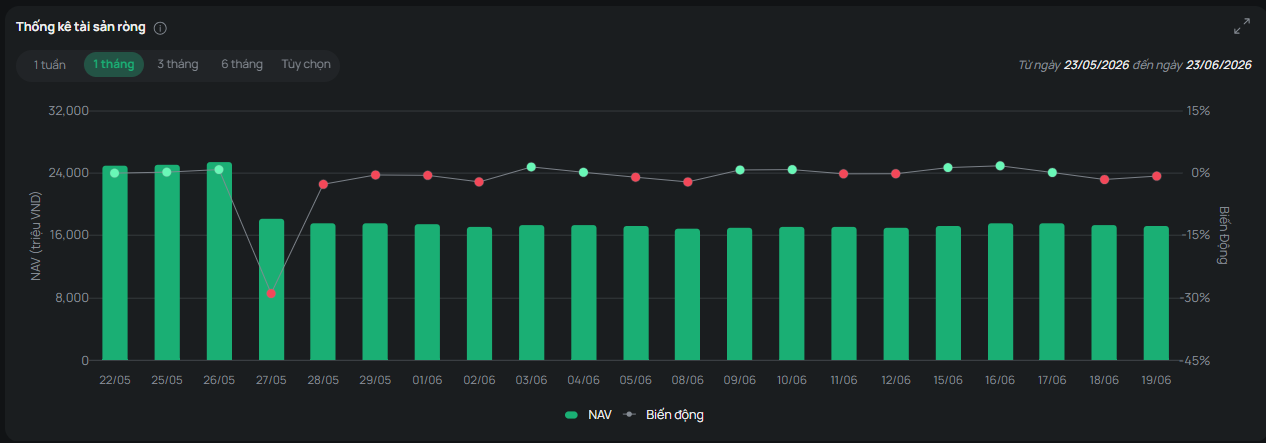
- Selectable time frames: 1 week, 1 month, 3 months, 6 months, and custom. Click “Custom” to select a specific time frame.
- Hover over each data column to view detailed information on net asset value changes for a specific day
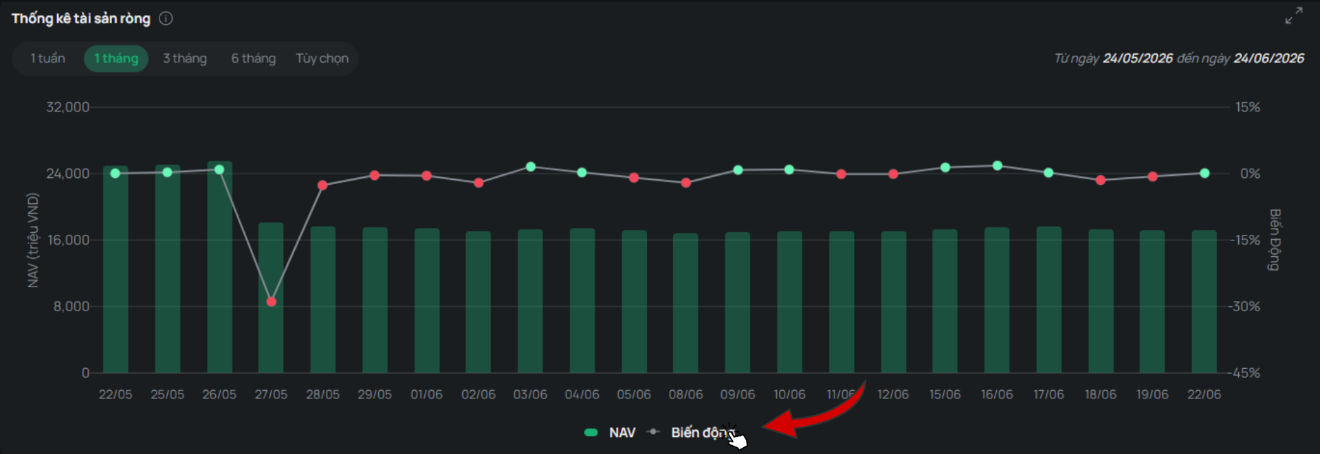
- Hover over a chart legend item to have the chart focus on displaying that data
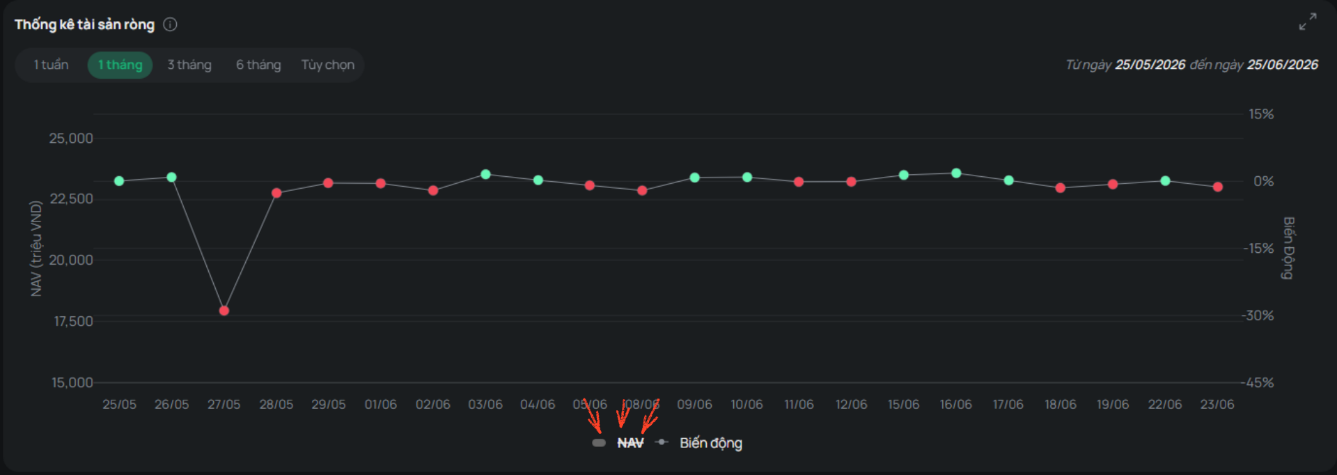
- Or click a legend name to hide that data field from the chart
- Click icon to expand the chart
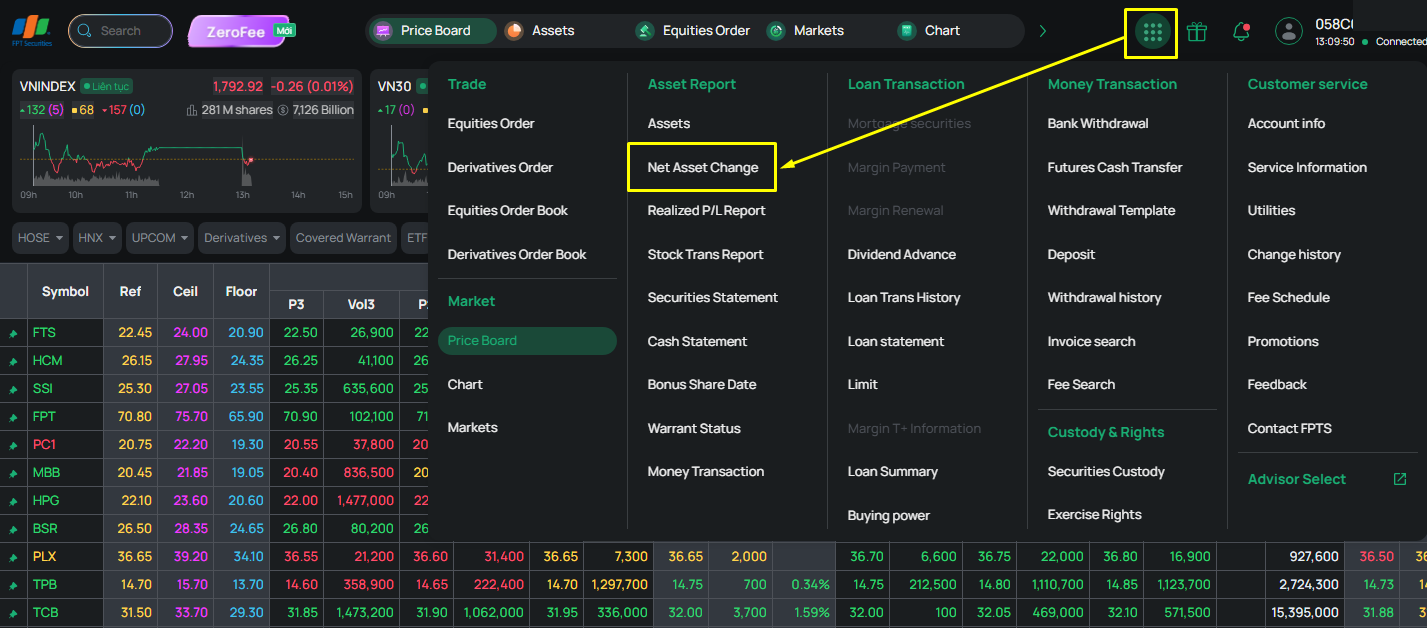
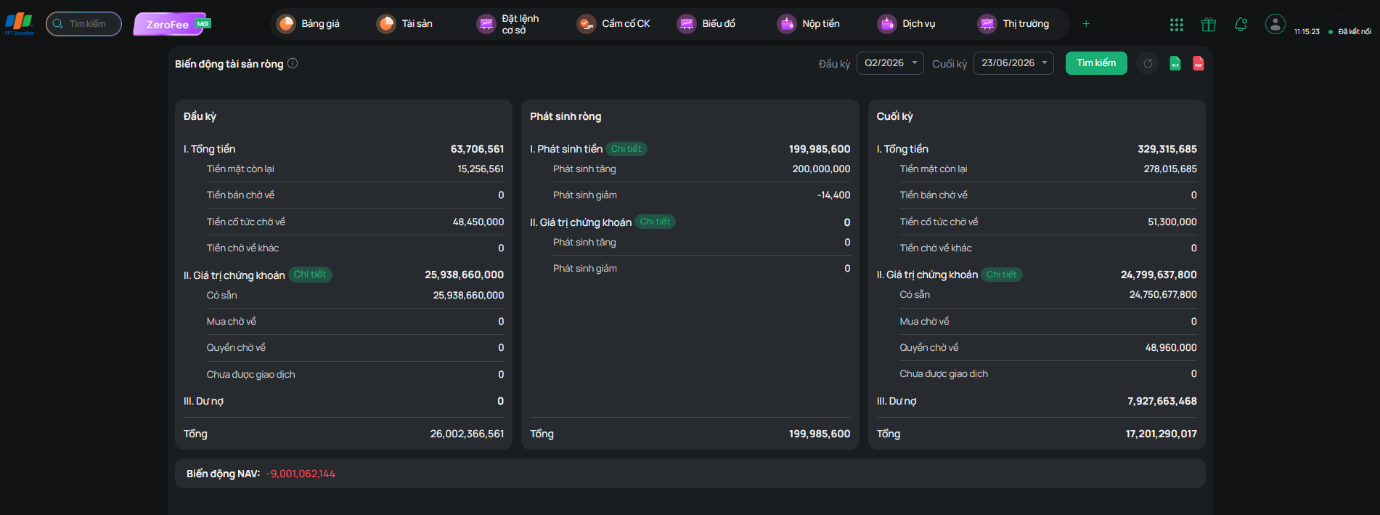
The Net Asset Value Change Report helps you track your net asset value over each period and the change in net asset value (NAV) by excluding external capital changes, allowing you to assess your investment performance.
Some features of the report:
- Data is finalized at the end of each quarter, so the beginning-of-period data is the data from the start of each trading quarter, and the end-of-period data is the data from the most recent trading session or the last trading day of the quarter.
- The report is updated only once, at the end of the trading day.
- The report is updated at the end of the trading day
- Click icon
 to view the reports in detail by category
- Click icon
 to refresh the filter
Note: The Beginning-of-Period NAV and End-of-Period NAV figures exclude Money Lent to FPTS from the NAV calculation
- Beginning-of-period NAV, end-of-period NAV: In the Total Cash section, excluding the Money Lent to FPTS field
- Net Change: Includes transactions related to Money Lent to FPTS in the increase/decrease breakdown. Specifically:
- Increases: Loan settlements, interest on Money Lent to FPTS
- Decreases: New loans made, personal income tax on loan interest
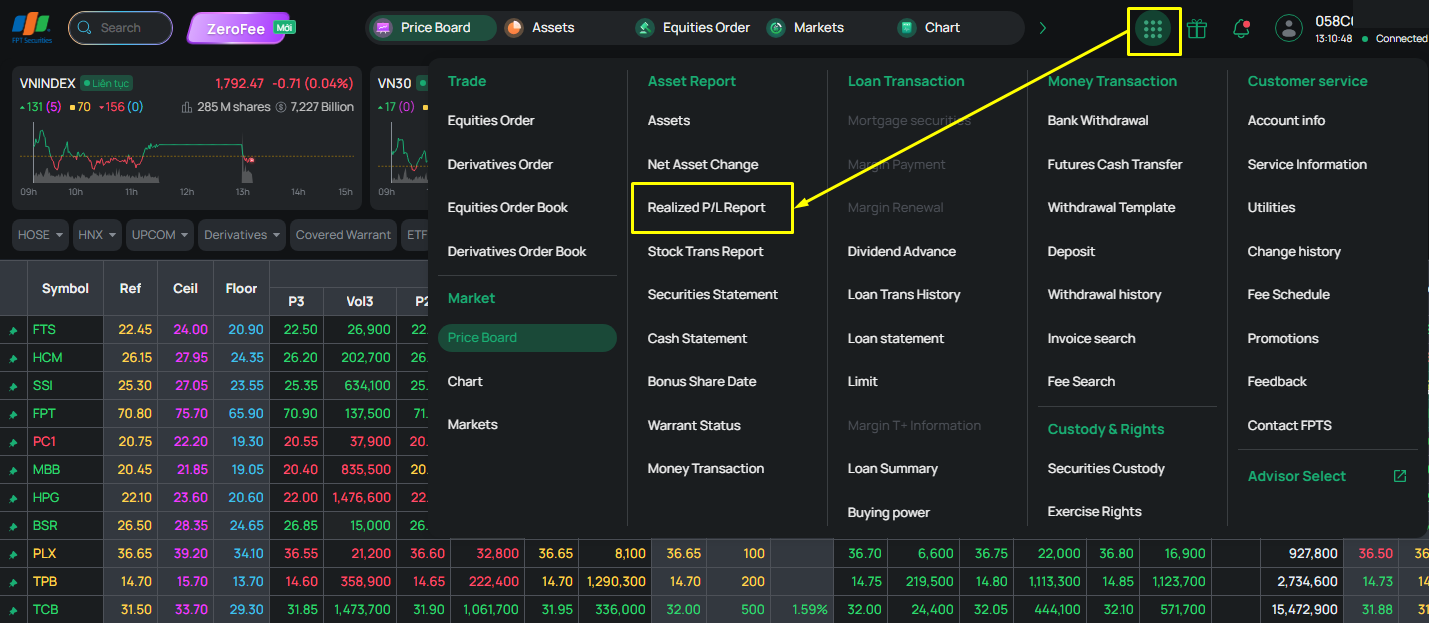
The Realized Profit/Loss Report summarizes transactions arising from securities Sell orders and evaluates investment performance based on each such Sell transaction.
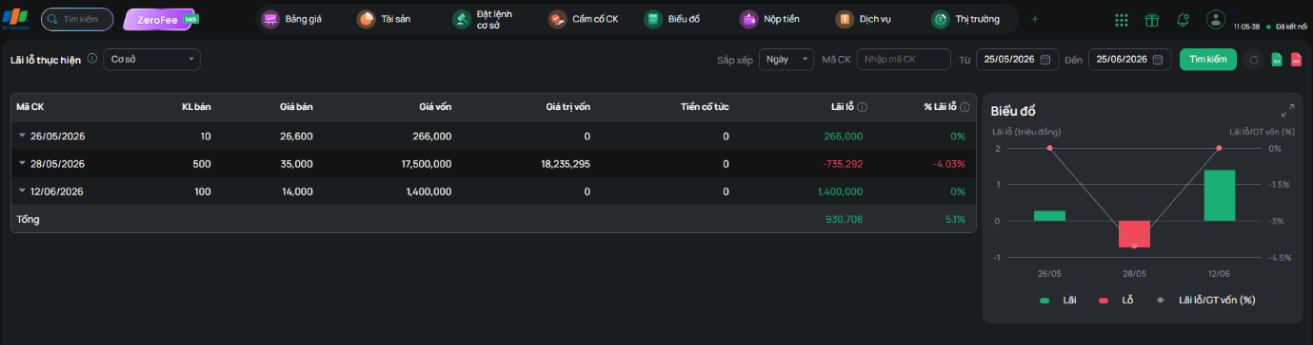
- Filter by Securities Symbol; you can enter a symbol or select from the symbols listed (these are the symbols with activity in the searched time period)
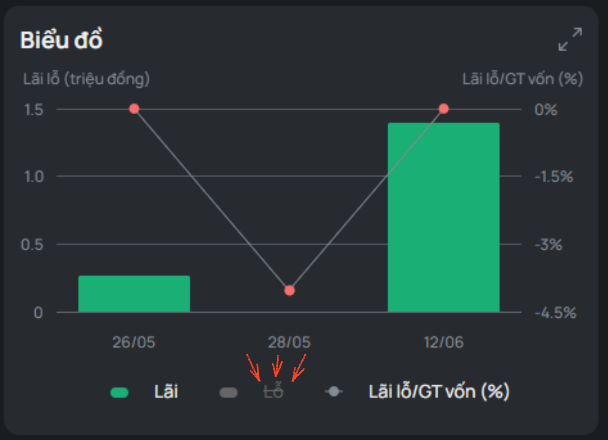
- Hover over a chart legend item to have the chart focus on displaying that data
- Hover over each data column to view detailed profit/loss information
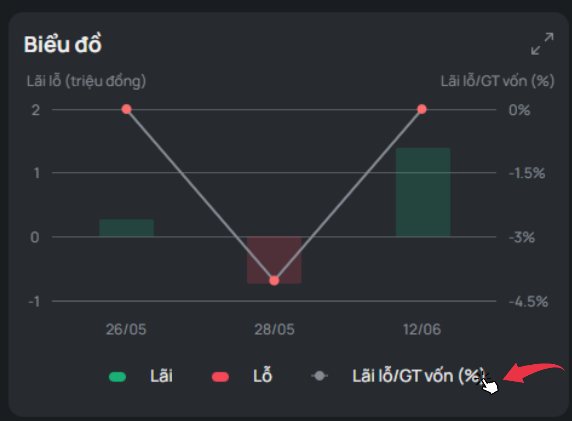
- Click a legend name to hide that data field from the chart
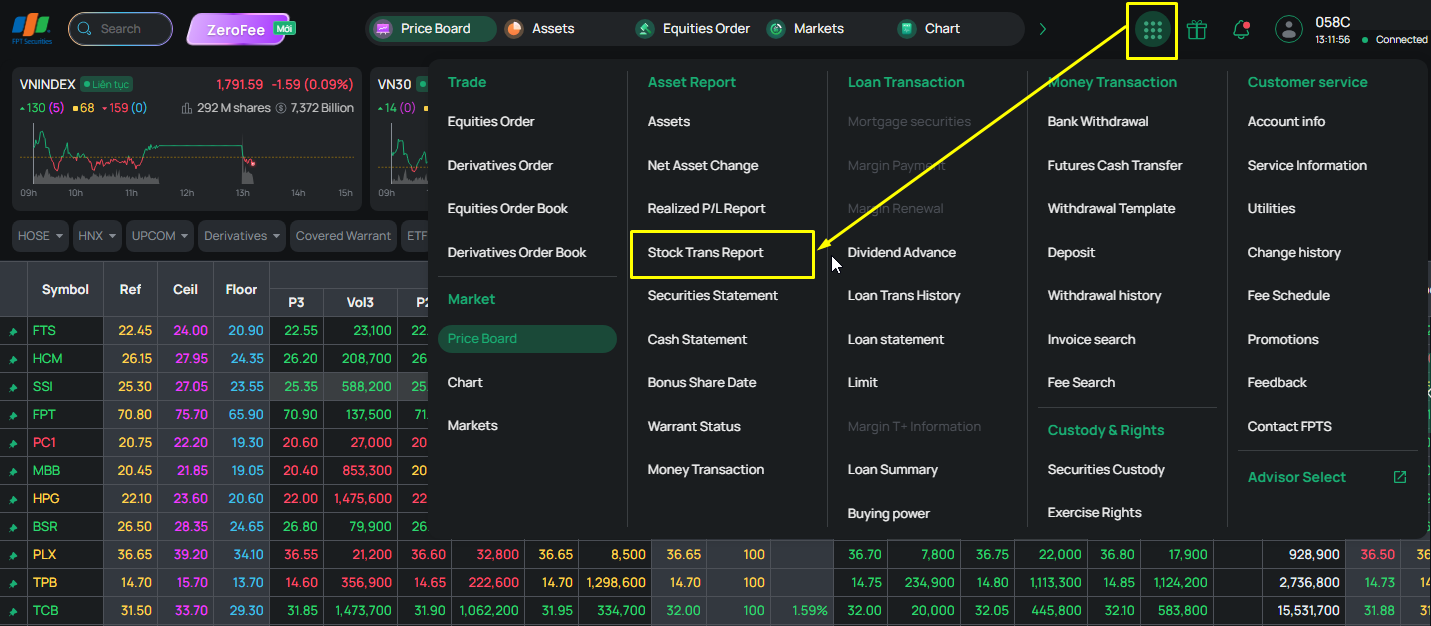
This report records the account's beginning-of-period securities balance, transactions during the period, and end-of-period balance, giving you an overall view of your assets so you can assess investment performance by securities symbol.
Some features of the report:
- The report is updated only once, at the end of the trading day.
- Data is finalized at the end of each quarter, so the beginning-of-period data is the data from the start of each trading quarter, and the end-of-period data is the data from the most recent trading session or the last trading day of the quarter.
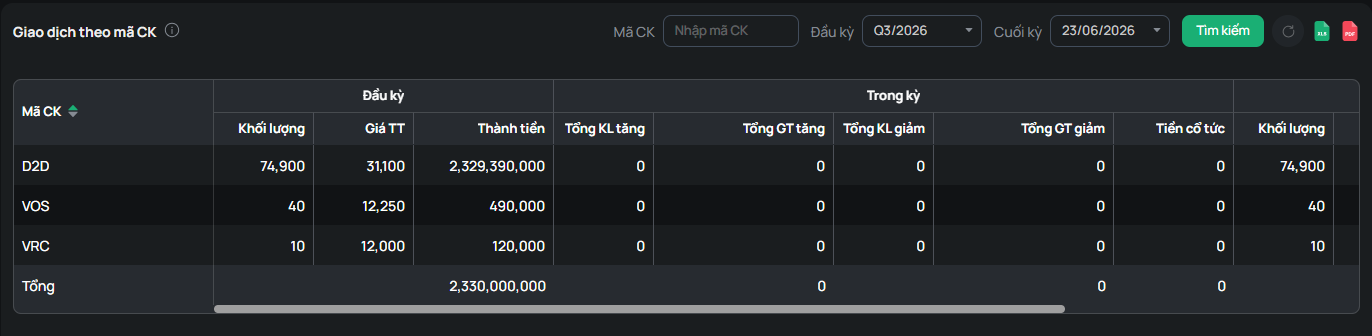
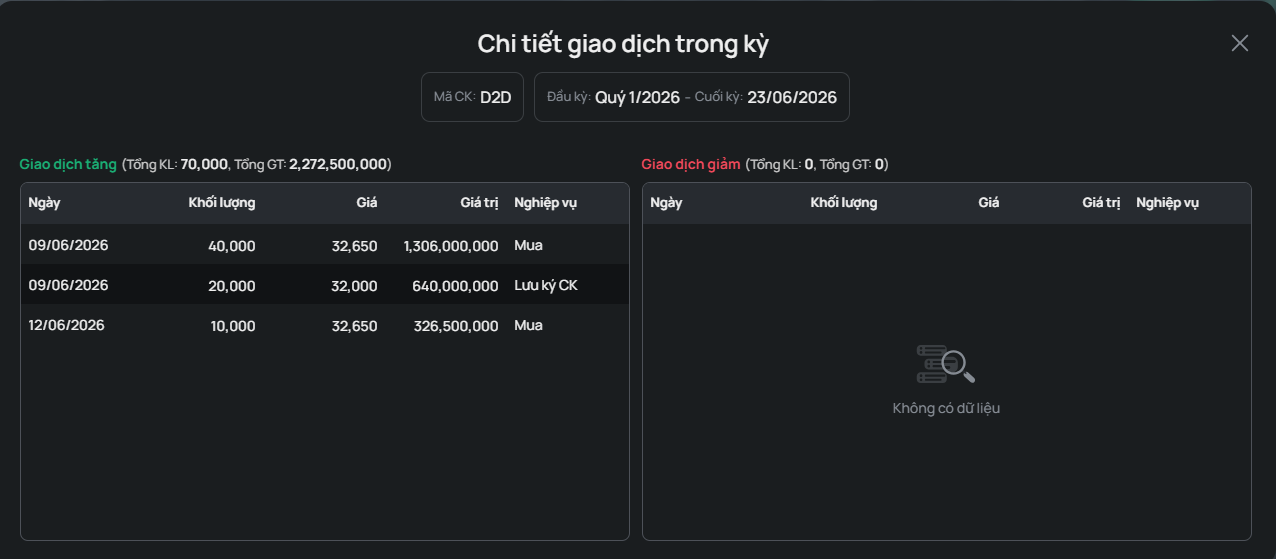
Clicking the details of a securities symbol displays a pop-up screen with details of the increase/decrease transactions for that symbol during the period