

1. Asset Report
The Asset Report lets you look up detailed information on: Account status, Open Positions, pending orders, total expected profit/loss on positions held during the session, matched orders, etc.
From the function list screen, select Report – Assets to go to the Asset Report screen
From the Asset Report screen, selecting the Derivatives module displays the following screen:
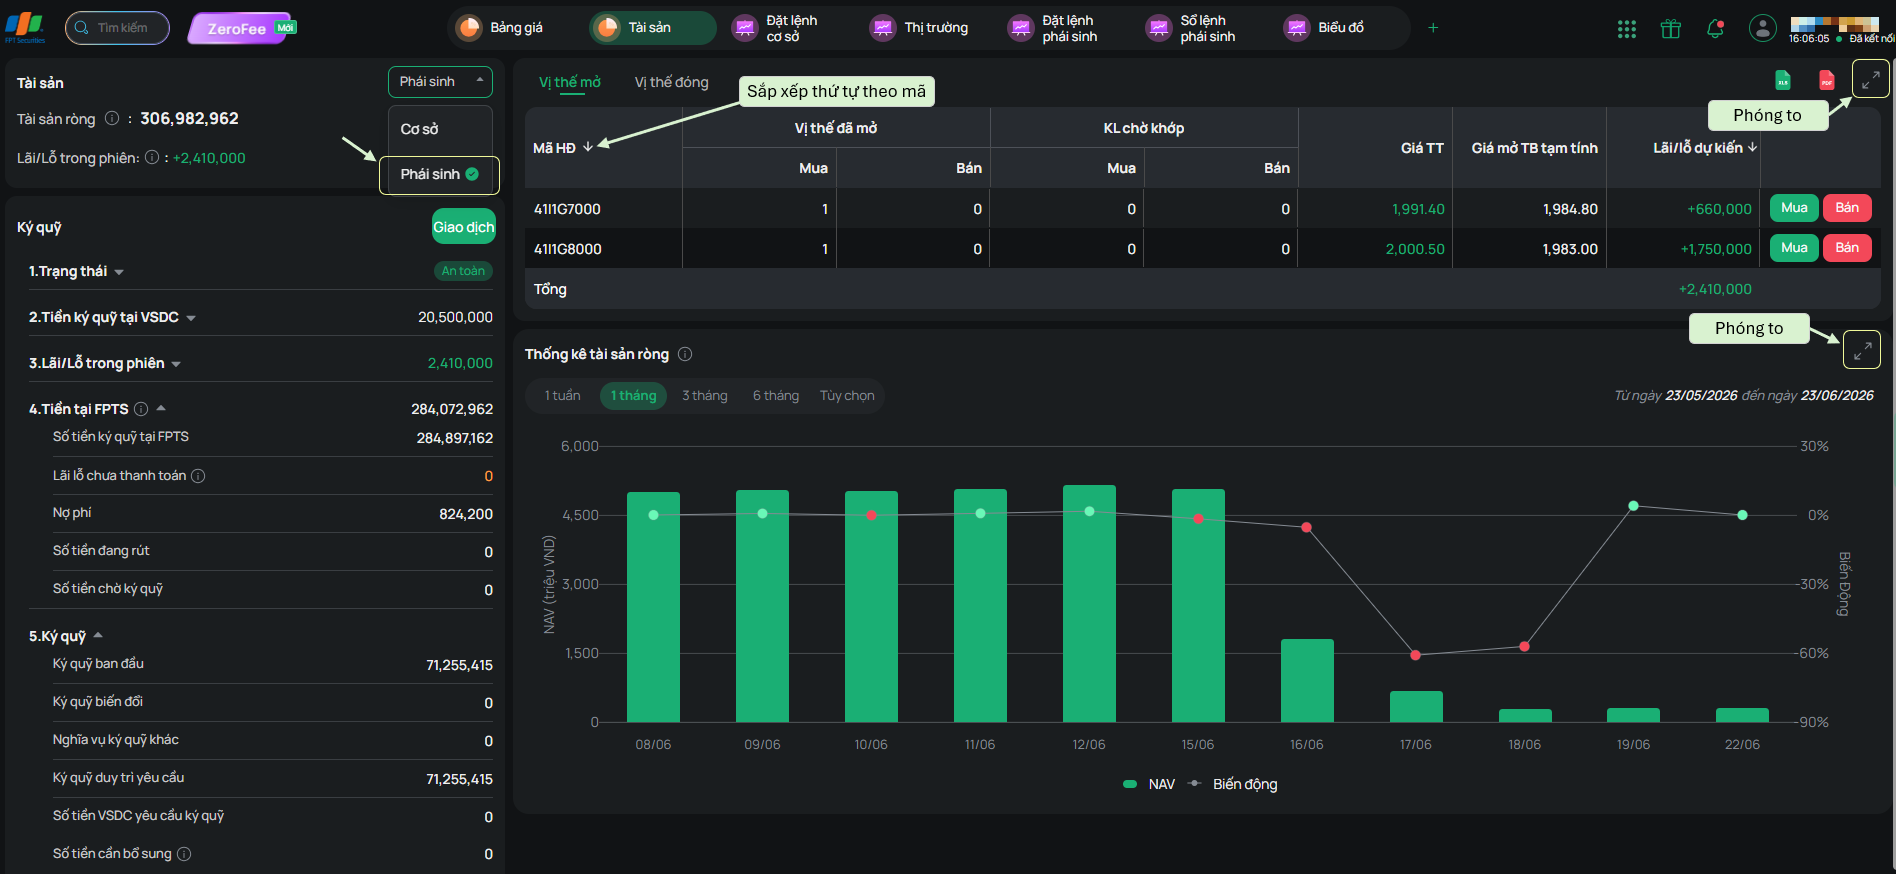
- In the “Margin” area, click icon
 /
/ on each major heading (e.g., 1. Status, 4. Cash at FPTS, 5. Margin) to expand/collapse its sub-items.
- In the “Open Positions” area, click “Buy”/“Sell” to open the derivatives quick order-placing screen
- To view positions closed during the session, select the “Closed Positions” tab
2. Net Asset Value Statistics
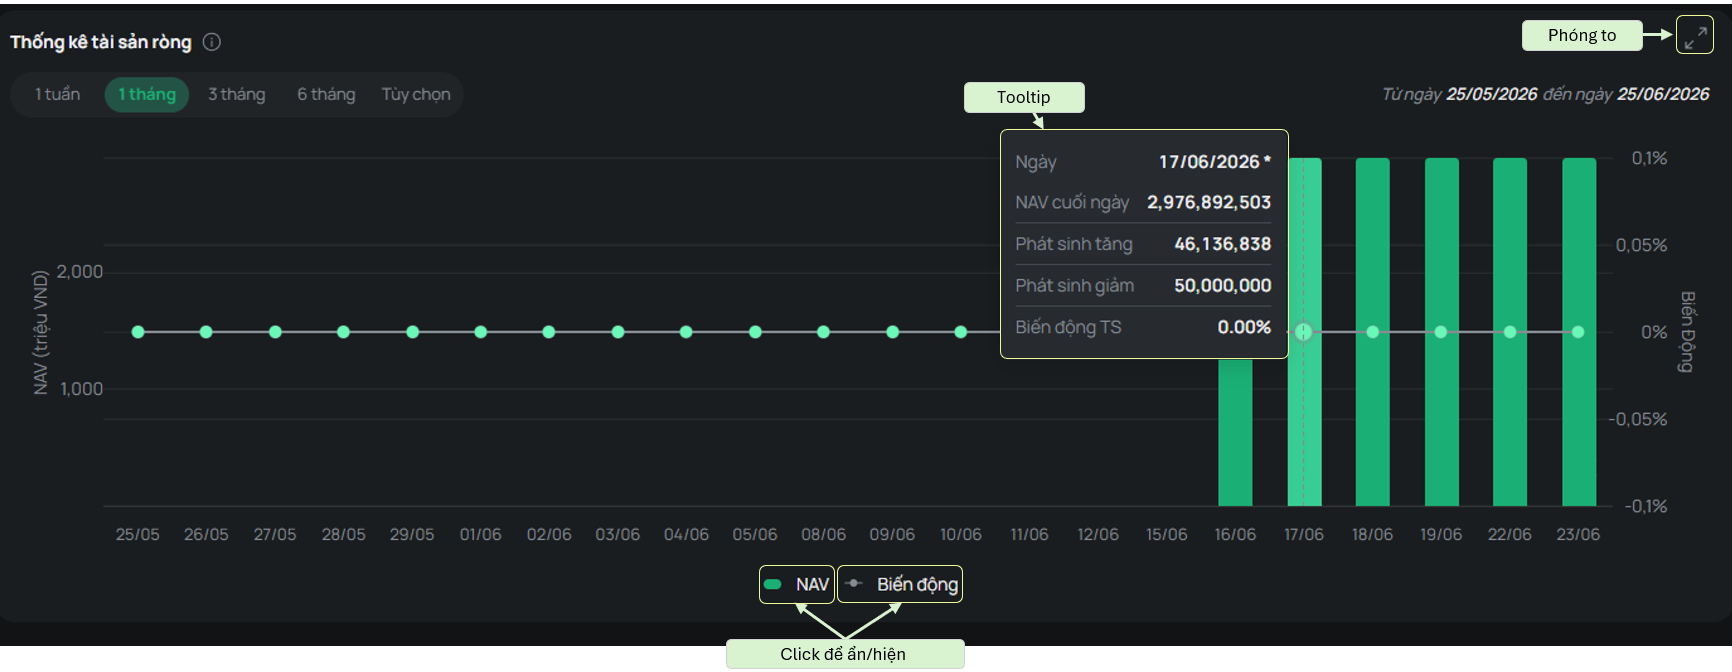
You can view net asset value fluctuations over the following time periods: 1 week, 1 month, 2 months, 6 months, or a custom time period
To view NAV details, hover over that day to display the detailed data.
When you hover over any item in the chart legend (“NAV” or “Fluctuation”), the other items on the chart will be hidden.
Data is updated as of the most recent data cut-off date.
3. Realized Profit/Loss
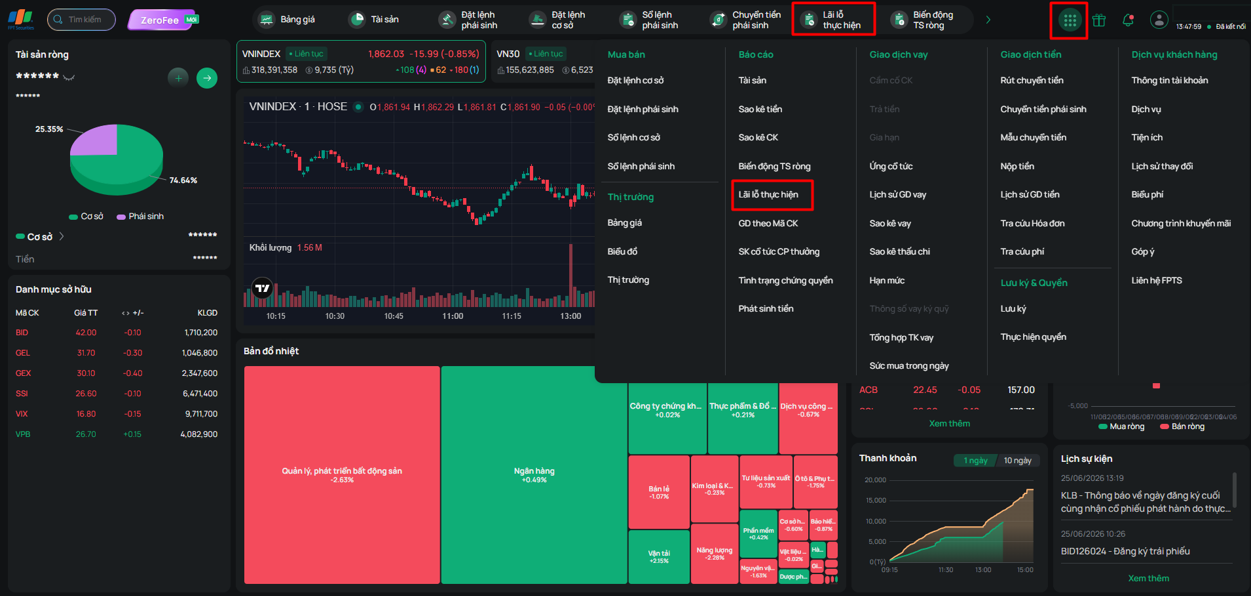
You can go to the ‘Realized Profit/Loss’ screen by selecting the ‘Realized Profit/Loss’ function on the ‘Function List’ screen, or by pinning this function to ‘Favorite Shortcuts’ for quick access.
Select the Derivatives module to view the realized profit/loss report for derivative securities. You can choose to view profit/loss sorted by Contract Symbol or by Trading Date.
Click button  to view the expanded chart, then click button
  to collapse the chart.
For sorting by Contract Symbol:
- You can click button
 to view details of the closed transactions for that symbol, by trading day, within the selected time frame
- The chart displays the total profit/loss of the symbols traded within the selected time frame
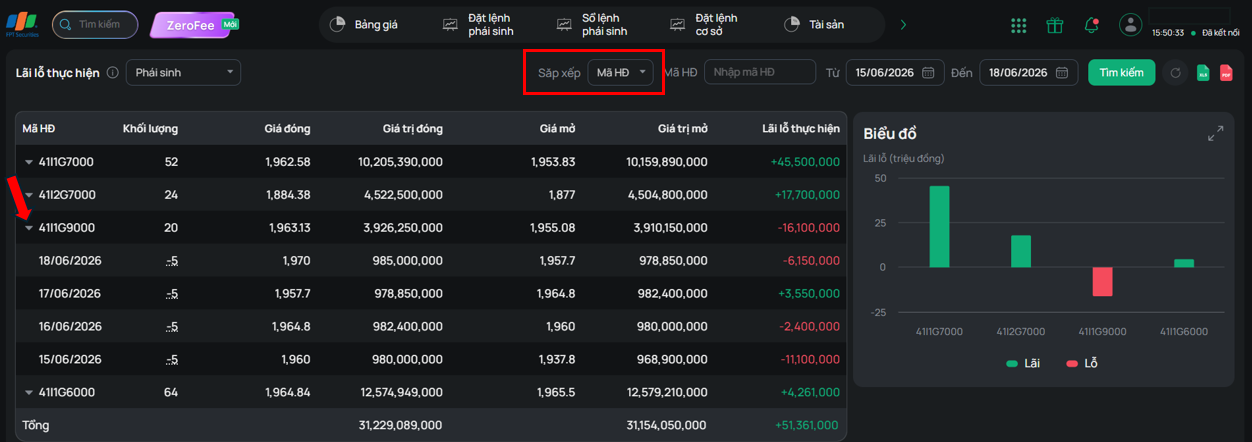
- When you hover over any item in the chart legend (“Profit” or “Loss”), the other items on the chart will be dimmed.
- When you click any item in the legend, that item will be hidden from the chart
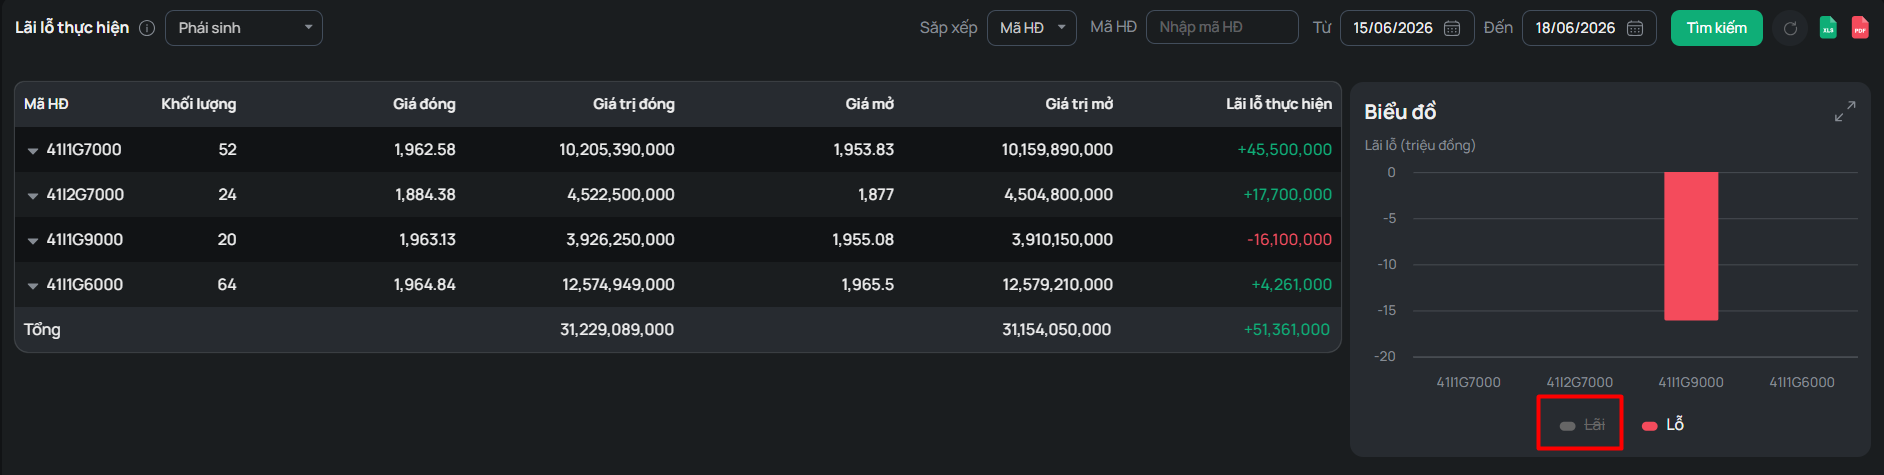
For sorting by Date:
- You can click button to view details of the closed transactions for each day, by contract symbol, within the selected time frame
- The chart displays the settled profit/loss for the trading days within the selected time frame
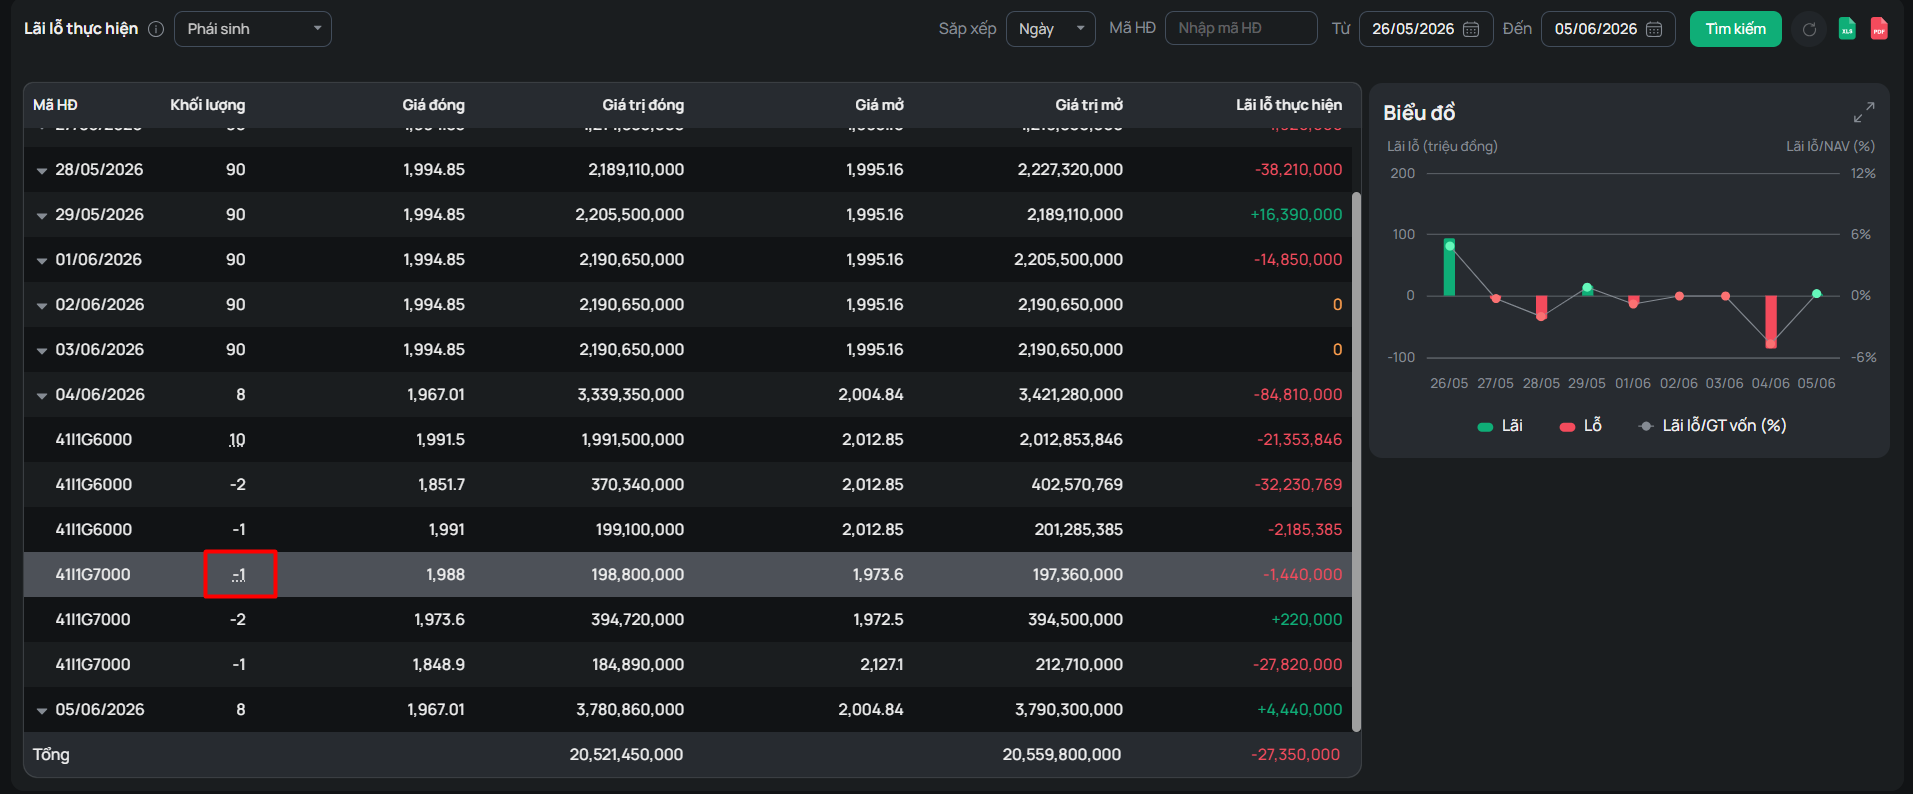
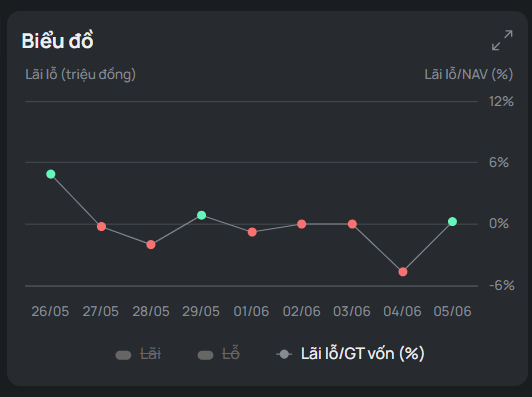
- Similar to the chart sorted by Contract Symbol, when you hover over any item in the legend, the other items on the chart will be dimmed.
- When you click any item in the legend, that item will be hidden from the chart
Derivatives Order Books
To view the derivatives order books, go to Function List and select “Derivatives Order Book”
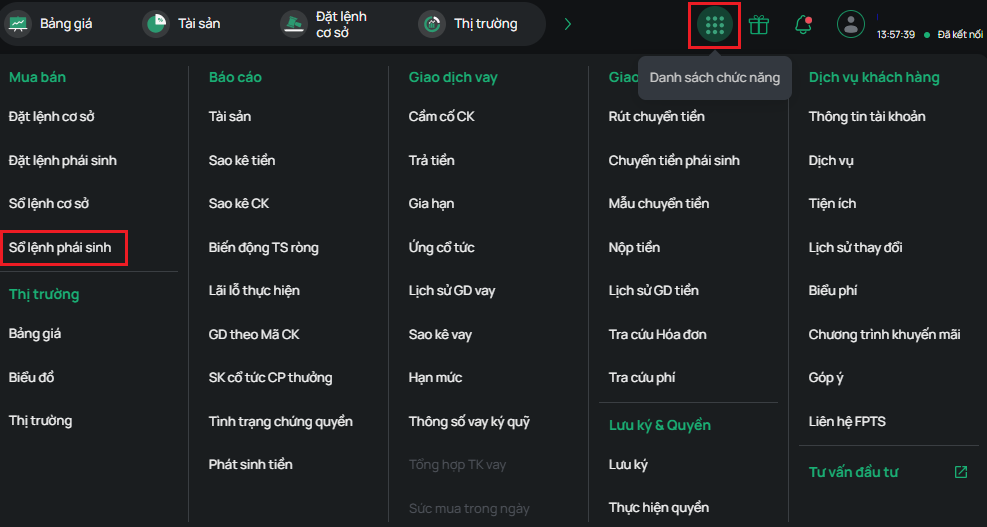
The Derivatives Order Book includes Pending Orders, Orders Matched in the Session, Intraday Orders, Conditional Orders, Matched Order History, and Order History

1. Pending Orders
The Pending Order Book displays regular orders and conditional orders activated during the session:
- Click button
 to edit a pending order, or click the button
  to cancel a pending order.
- Select “Cancel All” to cancel all pending orders in the order book
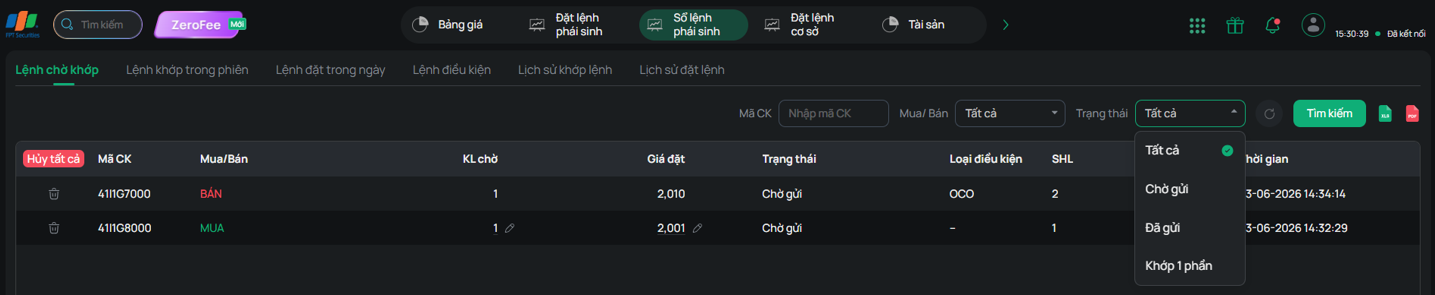
You can use the filter by Securities Symbol, Buy/Sell type, and order status to display orders as needed
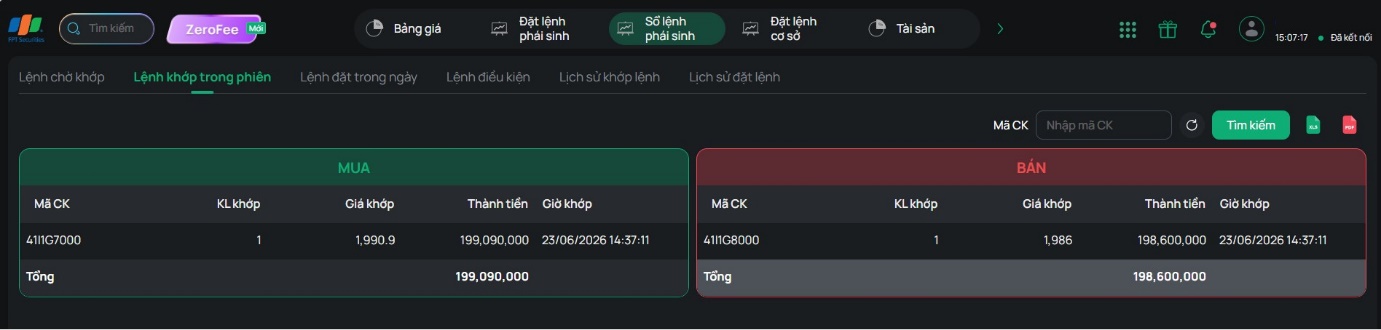
3. Today's traded orders
The Orders Matched in the Session Book displays orders matched during the session
4. Intraday Orders
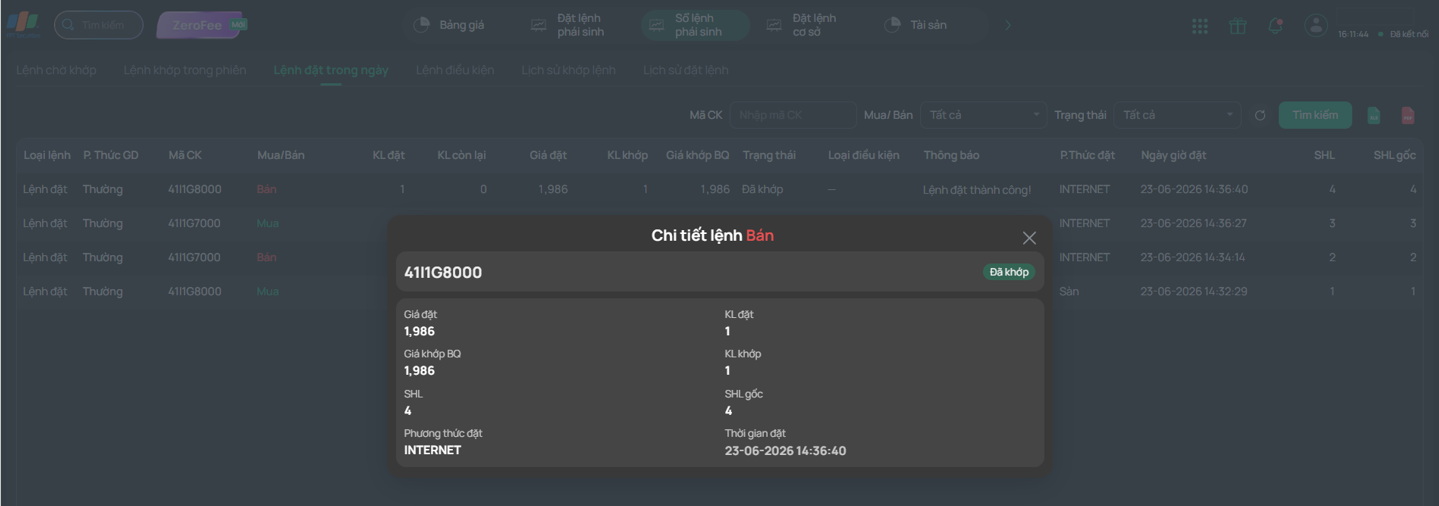
The Intraday Order Book displays regular orders, negotiated orders, and conditional orders activated during the session
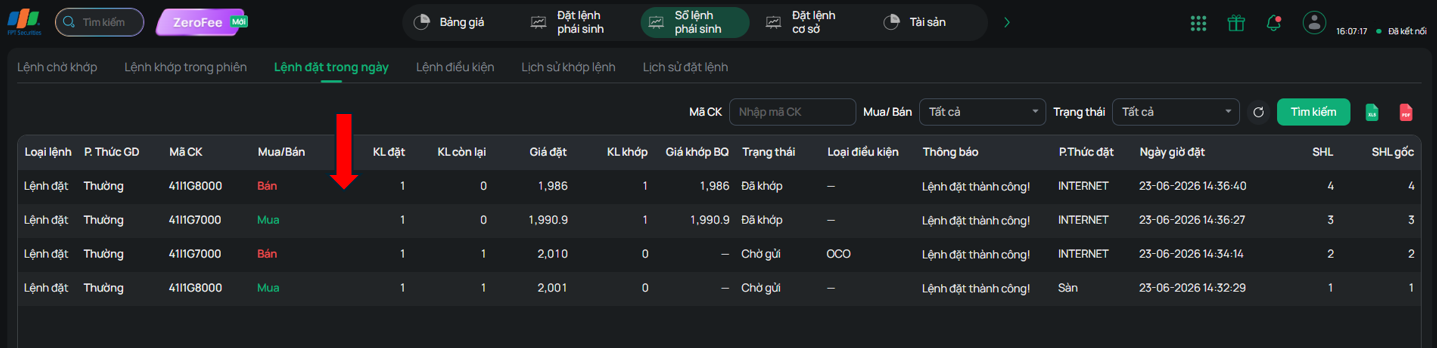
You can double-click the corresponding order row to view its detailed information
5. Conditional Orders
The Conditional Order Book displays, by default, all conditional orders you have placed within the past 3 months up to the current date.
On the Full Order-Placing screen, the Conditional Order Book's default filter shows conditional orders with the status Pending Activation
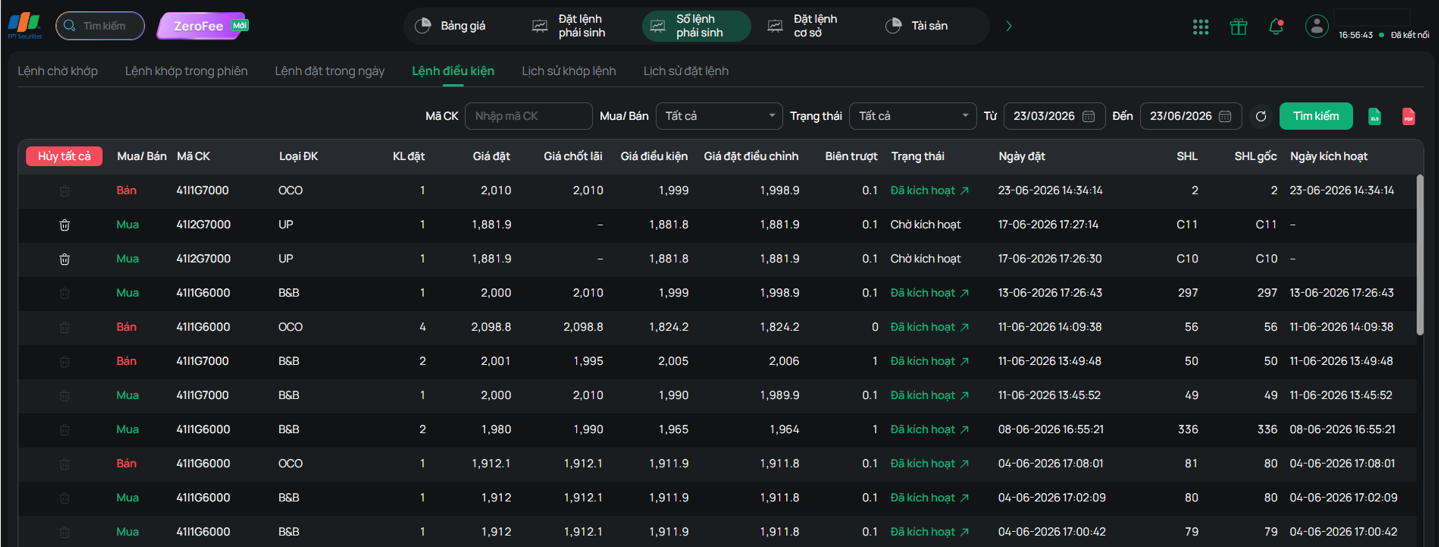
- Click button to cancel a pending UP/DOWN order. For an activated UP/DOWN order, or an OCO or B&B order, cancel it from the Pending Order screen.
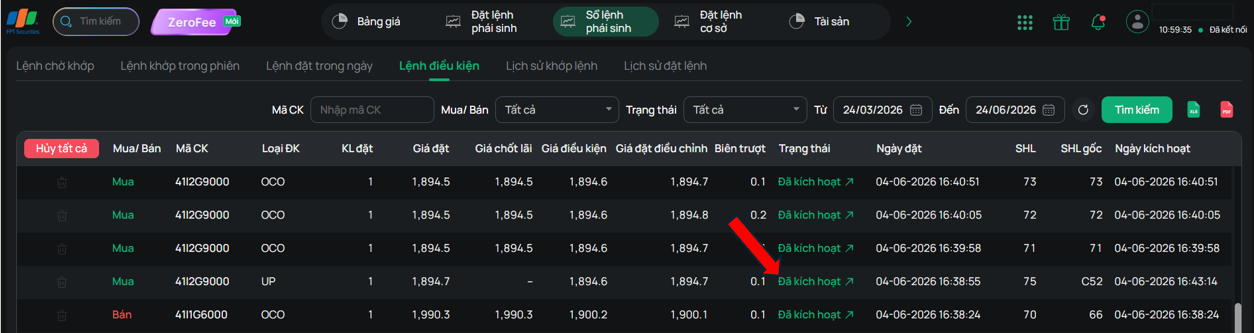
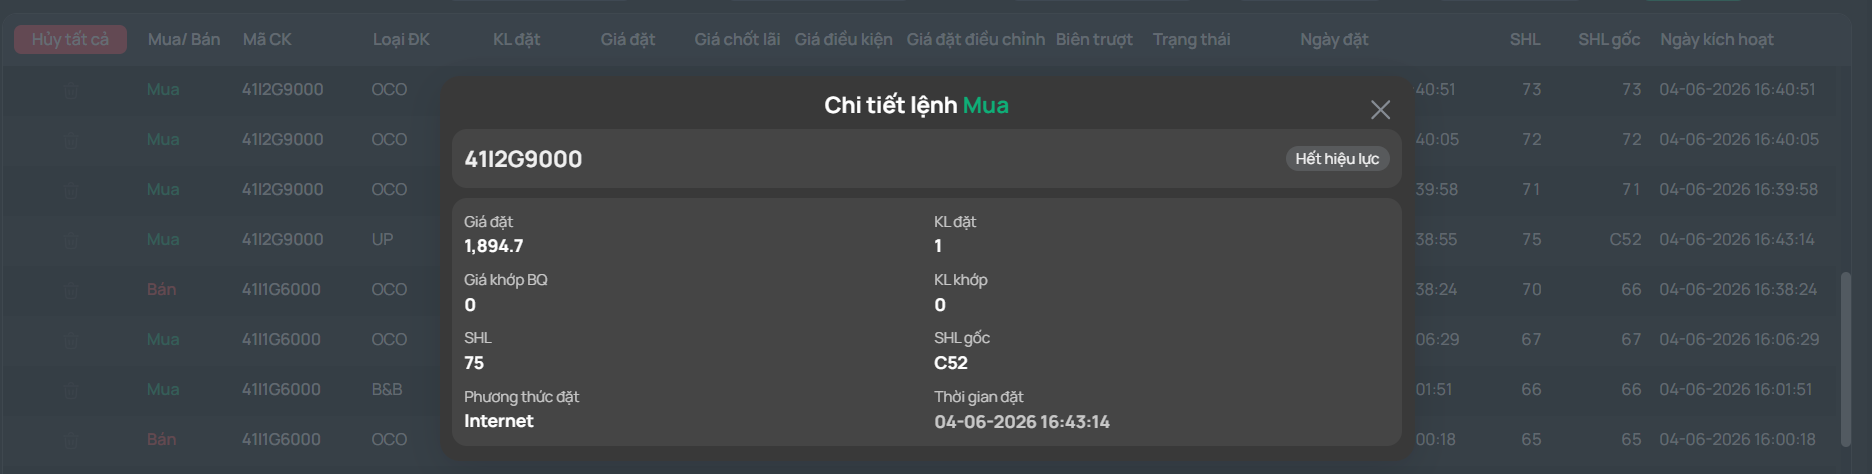
- Click the “Activated” status to view detailed information about an activated order
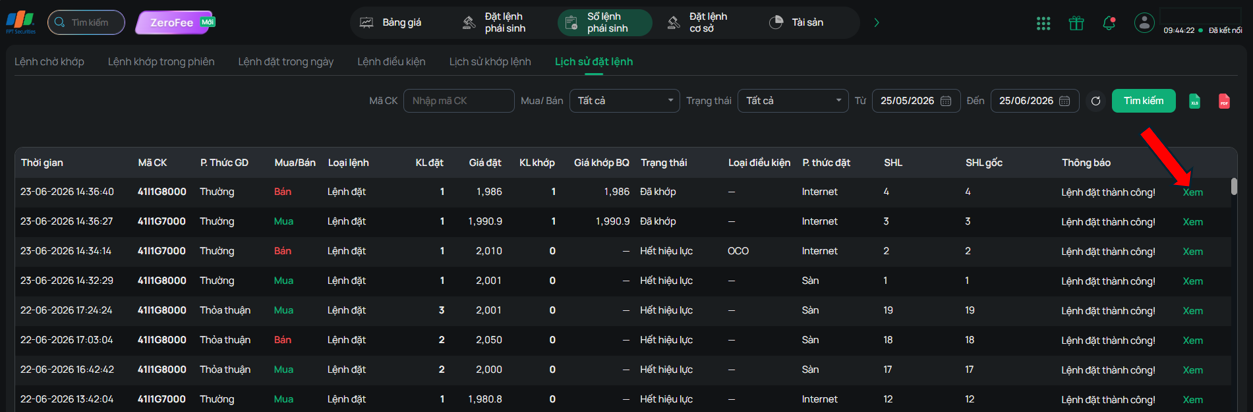
6. Order History
Order History displays the orders you have placed within the past year. You can use the filter by Securities Symbol, Buy/Sell type, order status, and time to display matched orders as needed.
Select “View” to see the detailed information of an order.
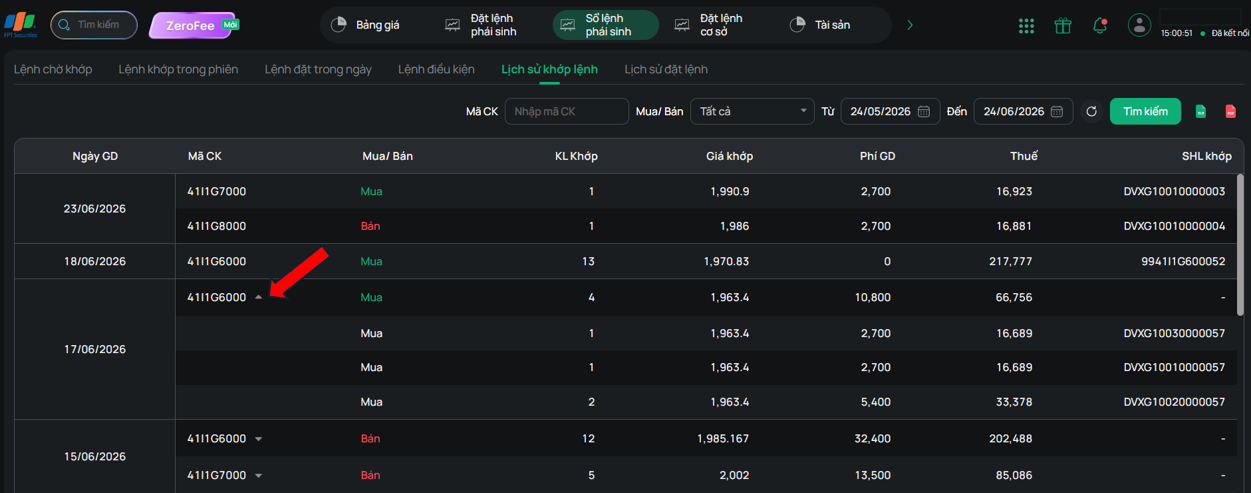
7. Traded Order History
Matched Order History displays your matched orders within the past year, grouped by securities symbol and Buy/Sell type. You can use the filter by Securities Symbol, Buy/Sell type, and time to display matched orders as needed
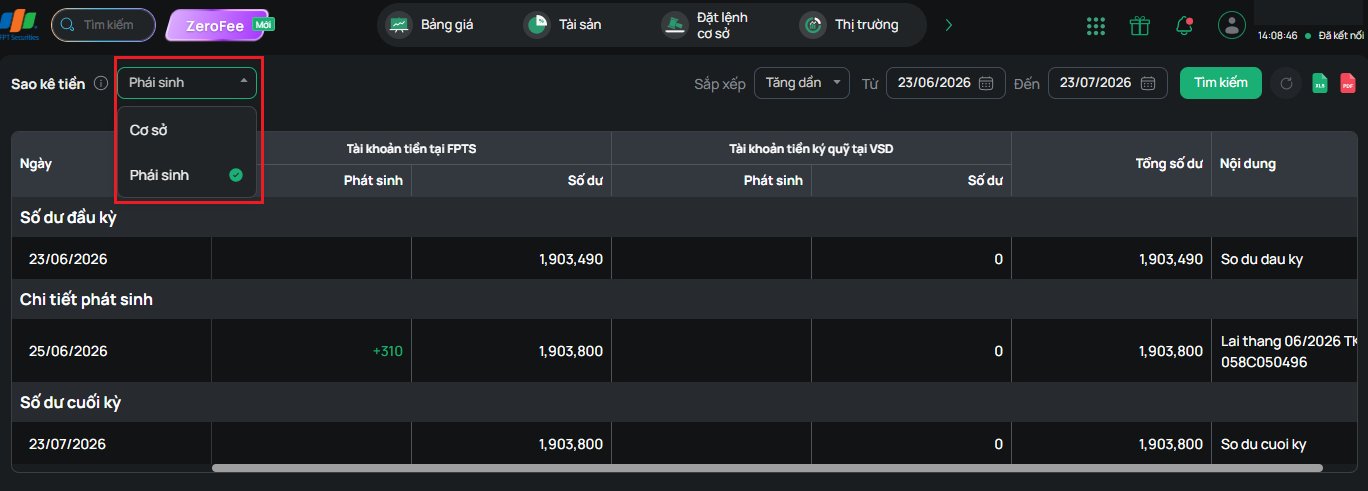
Cash Statement
Displays the beginning and ending balance and the increase/decrease transactions during the period, with an explanation for each change in amount, over the past year