

Instruction on HNX Pro Stock Board
1. Superior features to ordinary stock quotes
- Display at most 10 price rates and volumes for each of buying and selling sides. -Pro is the only online stock board capably displaying 10 best prices of each buying or selling side while conventional stock boards can display only three prices.
- More useful data columns for each stock symbol:
- Total buying/selling orders
- Total buying/selling volumes
- Weighted volume of a buying/selling order of a stock.
- Interface optimization:
- “Stock symbol” column may be changed
- More or fewer columns
- Sort data by column
- Other interface customizations
HNX and UPCoM listings are viewable in the same screen.
2. Instructions for special features
2.1. General information
- To show more price rate and data columns, related data are integrated into one column (two lines in a cell). Column headers help interpret data displayed beneath.
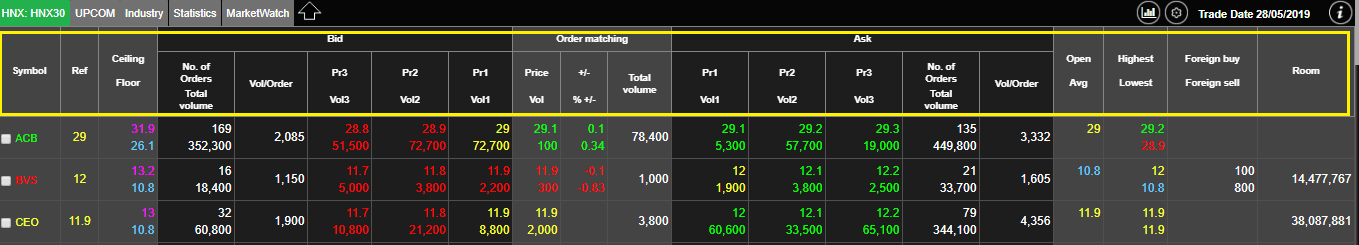
Example:
- The ACB stock shows the ceiling price of 31.9 and the floor price of 26.1. they are shown in the same cell.
- Similarly, this stock has the best buying price at 29 with a bid volume of 72,700 shares and the best selling price of 29.1 with 5,300 shares.
2.2. Special features
- Special features and view changes.
- Special features:
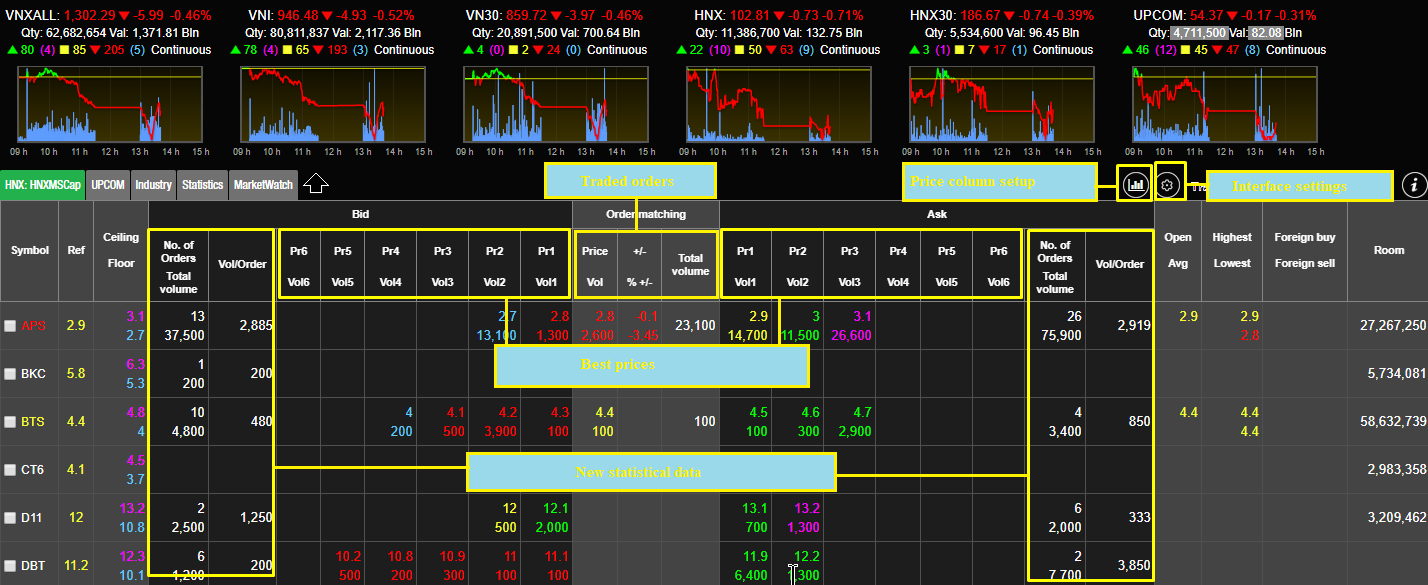
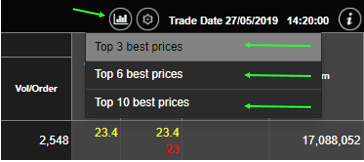
To show more or fewer best price columns, go to Price column setup. This function will show three options for best prices: 3, 6 and 10 price columns.
- New statistic columns: Two columns on the both sides of buying/selling price column sections.
- “Total orders - total volume” column shows:
- Upper line: Total buying/selling orders accumulated in the day
- Lower line: Total buying/selling volume accumulated in the day
- “Volume/Order” column shows the weighted volume of a traded order.
- Traded orders
- Price change column of every stock shows % price change in both decrease and increase.
- Total volume column is shown in the traded order column.
- Interface settings
- Click on the Interface Settings icon on the menu bar:

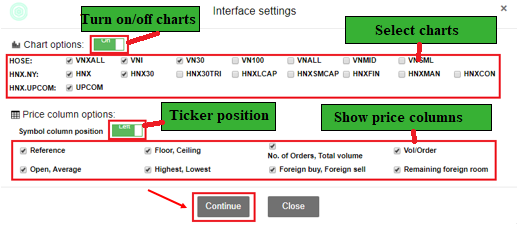
- Turn on/off charts
- Select charts: Check the charts you want to show
- Stock ticker column position: Select left or center to change the stock ticker column
- Select price column: Check columns you want to show
- After you select, click on “Continue” to save changes.
Note: In addition to the above special features, other features of the HNX Pro Stock Board are the same as Market Watch:
- Select by stock (technical analysis, stock details, historical price data, company information, etc.)
- Sort by column
- Create stock lists, add/remove stocks to self-created lists
- Others.